7 October 2026
Mastering the After Effects Graph Editor and Speed Curves
Say goodbye to stiff keyframes. Master the After Effects Graph Editor, Speed Graph, and Value Graph to build organic, professional motion curves.
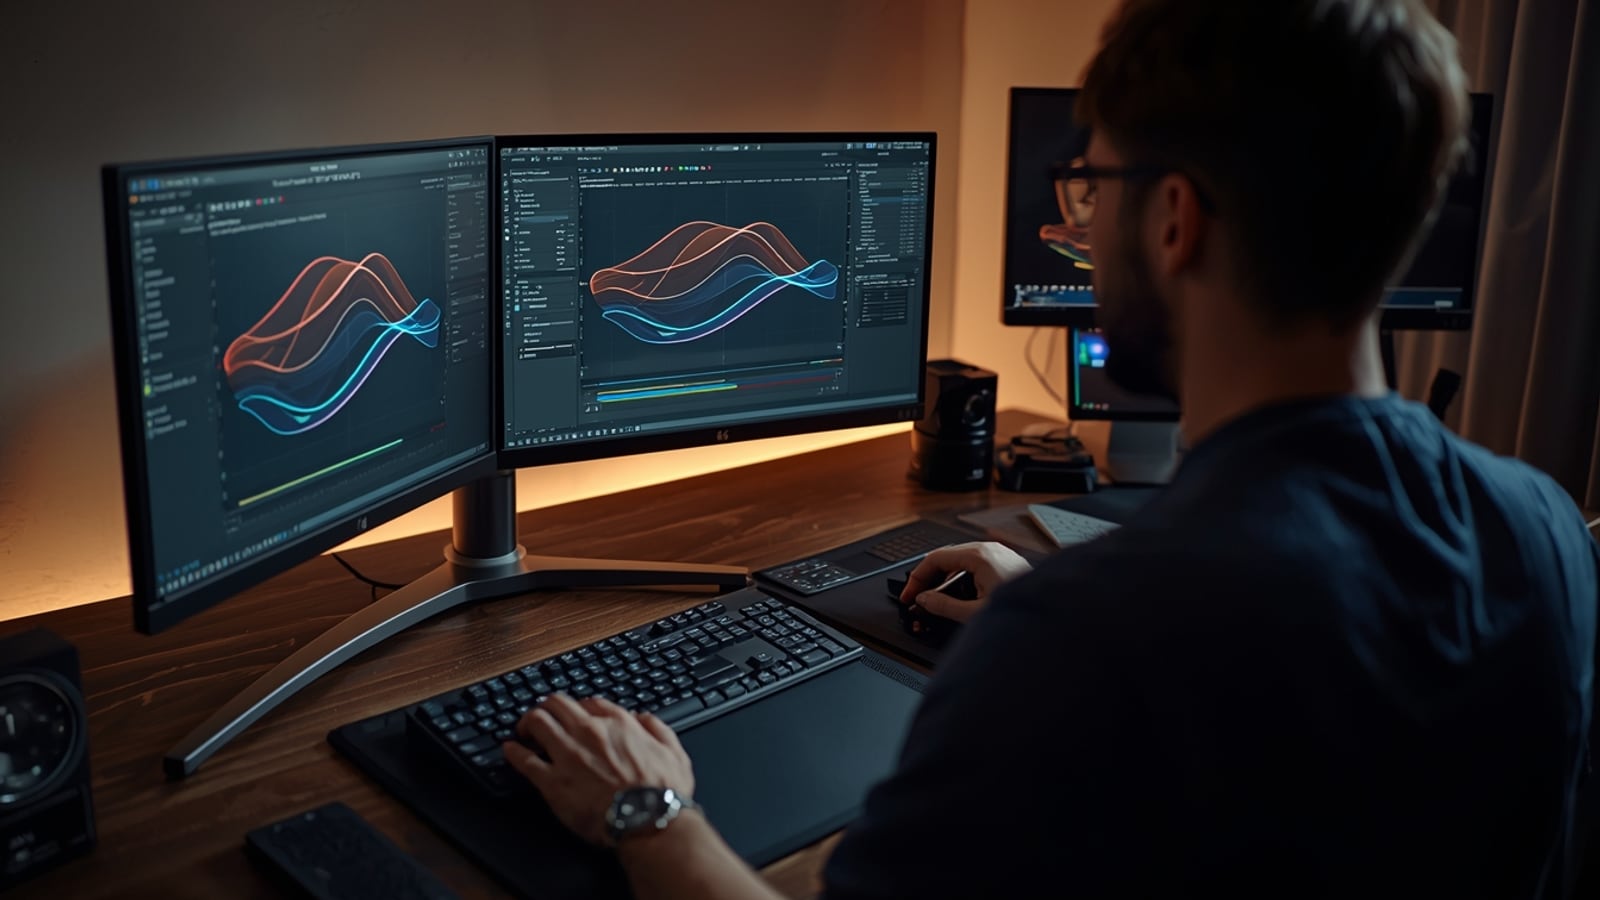
Refining velocity and acceleration curves in the After Effects Graph Editor.
Hitting F9 for a default Easy Ease between two keyframes is the first trick every motion designer learns in After Effects. But if you preview your work and notice that the movement feels sterile, lifeless, or distinctly digital, the issue usually isn't your timing. It is your acceleration. In the physical world, nothing launches or stops at a flat velocity; weight, friction, inertia, and elasticity dictate every micro-movement. That is where the After Effects Graph Editor and dedicated speed curves come into play.
Across more than a decade of creative direction and motion design, I have consistently found that mastery over speed and value curves is the defining line separating raw software operators from refined animators. In this guide, we will unpack how to read velocity profiles, break down Speed Graph vs Value Graph, and craft natural, punchy motion curves that elevate your design work.
Why Default Keyframes Ruin Motion Design
When you place two linear keyframes on your timeline, After Effects computes a straight line between point A and point B. The object instantly transitions from 0 to top speed without ramping up, travels uniformly, and smacks into the final frame like a brick wall. The human eye detects this unnatural rhythm immediately.
Pressing Easy Ease applies an arbitrary 33.33% influence to the incoming and outgoing keyframes. While this softens the impact, treating every layer with this exact same preset makes an entire edit feel sluggish and repetitive. A sleek UI notification, an explosive piece of 3D kinetic typography, and a heavy cinematic title card demand wildly divergent physics.
Opening the Graph Editor transforms your horizontal timeline into an active velocity or coordinate curve. Here, manipulating bezier handles allows you to dial in weight, tension, and atmospheric drag. If fluid, deliberate motion is your goal, treating the Graph Editor as your primary workspace is non-negotiable.
Speed Graph vs Value Graph: Knowing the Difference
Clicking into the Graph Editor interface reveals two distinct modes through the Graph Options menu at the base of the panel: Edit Speed Graph and Edit Value Graph. Misunderstanding how these two interpret data is the primary hurdle for intermediate artists.
1. Speed Graph (Velocity Profile)
The Speed Graph plots velocity on the vertical axis (measured in pixels per second) against time on the horizontal axis.
- What it shows: As the curve rises, the layer accelerates. The apex of the arch marks peak velocity, and descending slopes indicate deceleration down to zero.
- Ideal use cases: It is built for timing transitions and directional speed. If you are animating interface modals, lower-thirds, or title reveals that need to whip into frame and glide into place with a lingering finish, the Speed Graph provides direct control over momentum.
- Workflow tip: After easing your points, pull the outgoing handle of the final keyframe far to the left. You create a dramatic ramp where the layer achieves instantaneous speed and then spends 80% of its duration coasting smoothly to a halt.
2. Value Graph (Positional and Numerical Trajectory)
The Value Graph plots the actual numeric value of a property (degrees of rotation, coordinates in screen space, opacity percentages) against time.
- What it shows: The line literally maps where the value sits. The steeper the angle of the line, the faster the change. A completely horizontal line indicates zero motion.
- Ideal use cases: Overshoot, rubber-banding, bounces, and anticipations are nearly impossible to calibrate visually inside a Speed Graph. In the Value Graph, you simply drag the bezier curve past the destination line and curve it back down, giving you exact visual feedback on how far an element overshoots its landing mark.
- Crucial step: When working with 2D Position, you must right-click the property and select Separate Dimensions. If X and Y are locked together, After Effects will not expose editable bezier handles in the Value Graph.
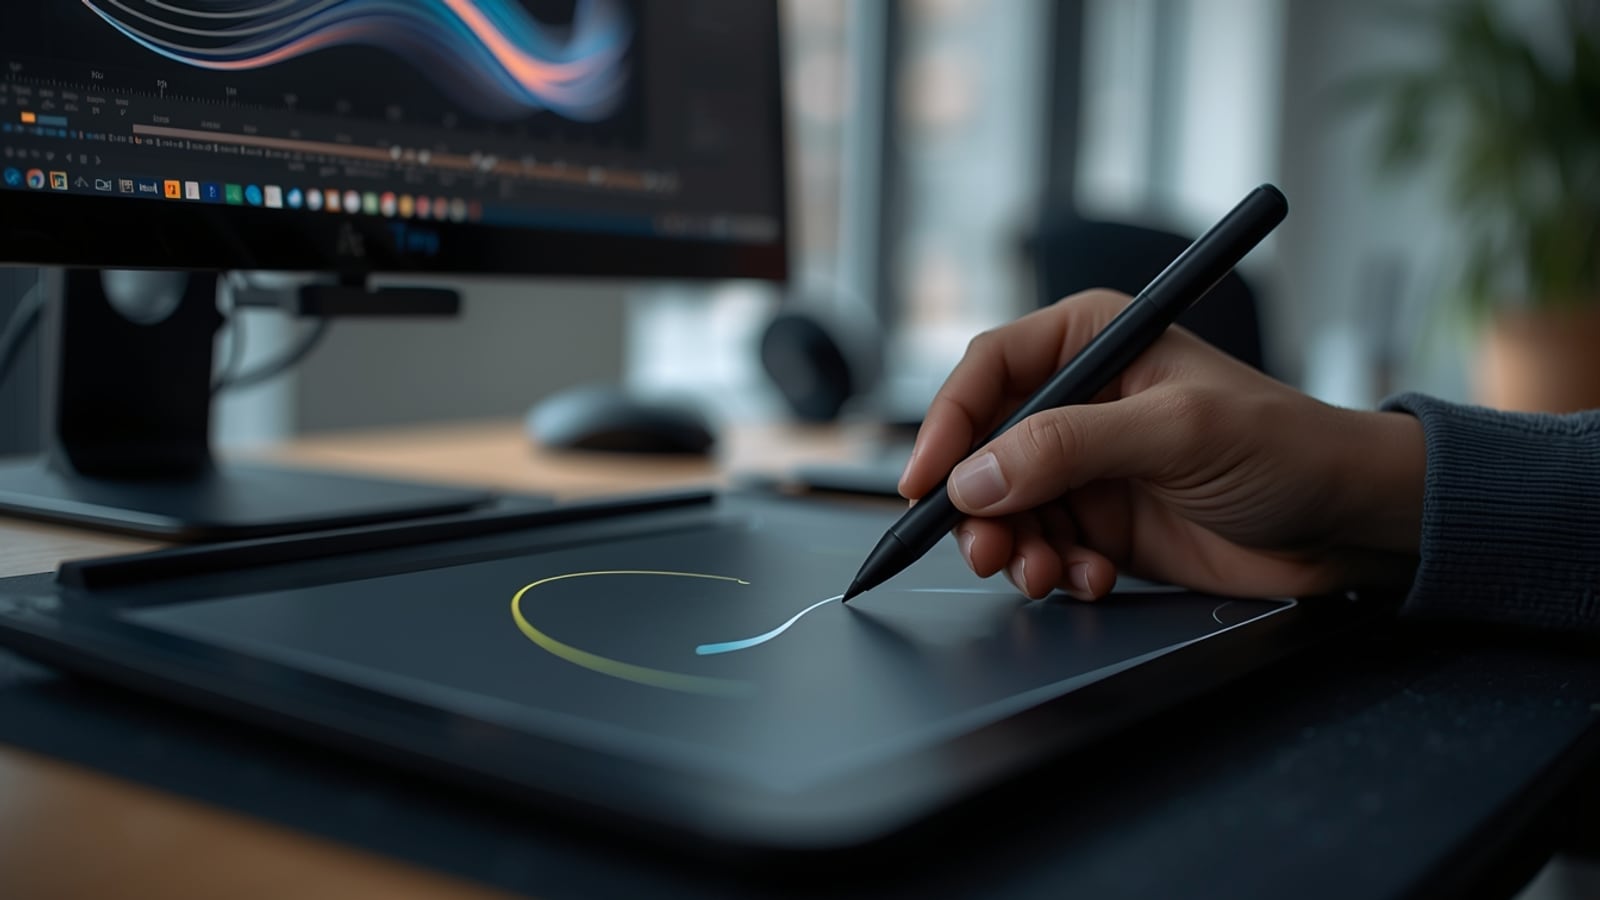
Calibrating velocity and positional values precisely using Speed and Value Graphs.
Step-by-Step: Crafting the Modern "Snappy" Curve
Contemporary brand identities and digital interfaces lean heavily into "snappy" kinetic systems: quick, responsive bursts followed by smooth dampening. I frequently rely on these curves in high-energy production deliveries, such as the screen graphics created for the Survivor 2023 Motion Design project, to ensure on-screen clarity without losing momentum. Here is how to configure it manually:
- Set Keyframes: Add two keyframes on Position, Scale, or an Angle property across 20 to 30 frames.
- Apply Initial Ease: Highlight both keys and hit F9. Toggle into the Graph Editor.
- Switch to Speed Graph: Verify that Edit Speed Graph is checked in your graph settings.
- Pull the Influence Handles: Select the right keyframe. Hold Shift and drag its yellow bezier handle leftward until the influence metric reaches roughly 75% to 85%. Select the left keyframe and pull its handle slightly to the right, landing around 40%.
- Evaluate the Slope: You should now see an asymmetrical arc with a sharp peak early on that flattens into a long, luxurious tail. Your element will launch with immediate impact, spend zero time idling, and land with surgical precision.

Setting up asymmetrical velocity profiles for snappy and organic keyframe ease.
Four Pitfalls to Avoid in Motion Curves
Even experienced editors fall into recurring traps when adjusting curves manually:
- Uniform Easing Across All Layers: Weight dictates momentum. An ultra-light text label can snap to a halt in 12 frames, but a massive product render needs a longer lead-in and decay to convey heft. Adjust your curve peaks according to visual mass.
- Neglecting Dimension Separation: Leaving X and Y coordinates joined restricts you to spatial bezier handles in the viewport rather than temporal control in the graph. Separate your dimensions early to control your vertical drop independently from horizontal glide.
- Pinched 100% Extremes: Pulling your bezier handles completely flush against the 100% boundary can squash the movement into a single frame, resulting in visual strobing where the viewer cannot track the trajectory. Keep your peak velocity readable across at least 2 to 3 frames.
- Forgetting Motion Blur: Crisp curves running at high speed will produce harsh temporal aliasing unless native motion blur is enabled on both the layer and the master composition settings.
Scripts and Plugins vs Manual Mastery
Third-party utility panels like Flow, Motion 4, or EaseCopy are industry staples. Applying a saved 80/20 cubic-bezier curve in a single keystroke is indispensable when managing tight commercial turnaround times. However, leaning on scripts without understanding the underlying curve mechanics turns designers into template applicators. Master the native bezier handles first; let workflow extensions accelerate your output, not replace your fundamentals.
Spend your next few animation passes experimenting inside the Graph Editor rather than accepting default easing. The difference in production value is night and day.
If you are planning an upcoming motion identity, UI animation system, or visual campaign, feel free to reach out through my contact page to discuss how we can bring dynamic, polished movement to your brand.